Search Results for insights
Explore AI generated designs, images, art and prompts by top community artists and designers.
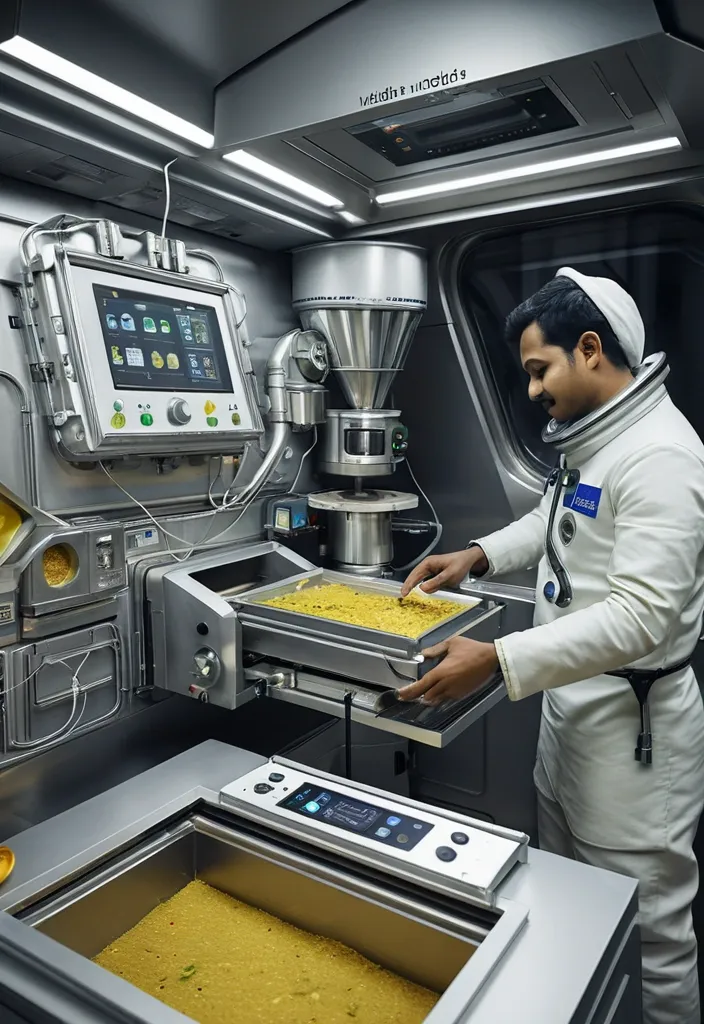

Inside a cramped , humming module of a lunar base , an astronaut is carefully tending to a samosa maker automatic digital machine , filled with vibrant , intricate holographic interface displaying complex samosa proccesing cartography. The scanner emits holographic monitoring data that showcases real-time food ingredients (Key ingredients include flour , ghee/oil , carom seeds (ajwain) , potatoes , green peas , cumin seeds , ginger , green chilies , coriander powder , dry mango powder (amchur) , and garam masala) statistics and insights above the machine , automates samosa ingredients tracking and gives you actionable insights to cut costs , reduce CO₂ , and boost efficiency , without changing how female kitchen works. The background is a sleek , minimalist command center , hinting at advanced technology and vast cosmic knowledge. The aesthetic combines the precision of 3D architectural rendering with the mystique of surreal landscapes. ,

futuristic modern kitchen design , a samosa maker automatic digital machine , holographic display light , neon accents , clean sci-fi kitchen environment. The scanner emits holographic monitoring data that showcases real-time food ingredients (Key ingredients include flour , ghee/oil , carom seeds (ajwain) , potatoes , green peas , cumin seeds , ginger , green chilies , coriander powder , dry mango powder (amchur) , and garam masala) statistics and insights above the machine , automates samosa ingredients tracking and gives you actionable insights to cut costs , reduce CO₂ , and boost efficiency , without changing how female kitchen works. cinematic lighting , high detail , concept art , best quality , 16K ,
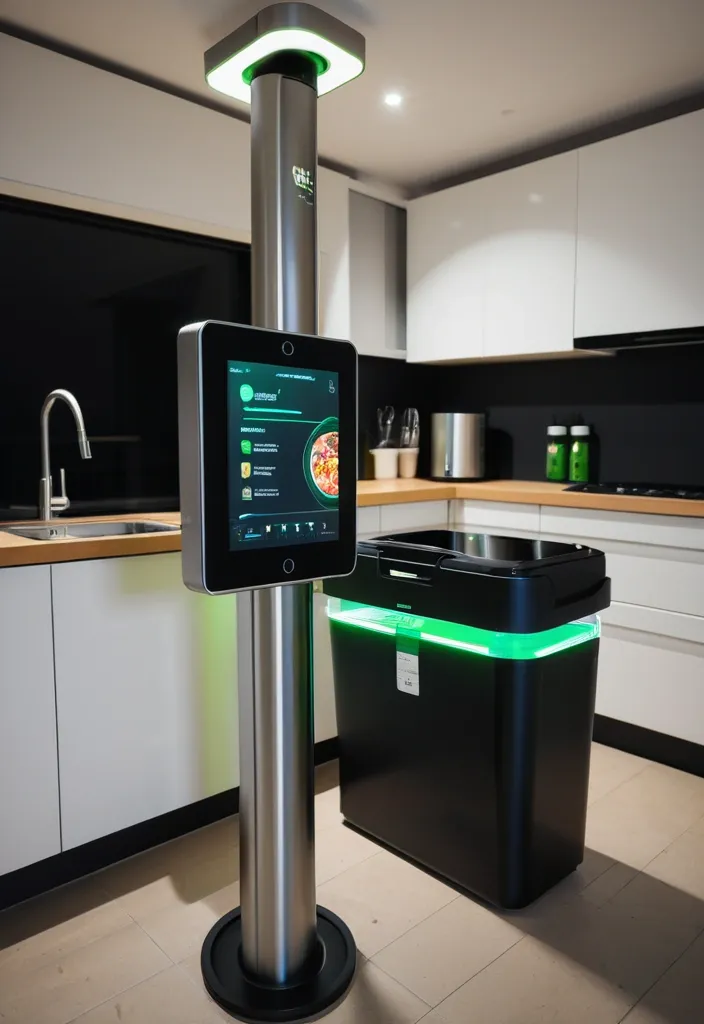
At night In a modern kitchen , at corner green trash bin stands prominently equipped with a sleek horizontally digital scanner mounted on a pole directly facing it. The scanner emits neon holographic monitoring data that showcases real-time food waste statistics and insights over the bin on screen. The kitchen surroundings are clean and bright , featuring contemporary appliances and vibrant decor. automates food waste tracking and gives you actionable insights to cut costs , reduce CO₂ , and boost efficiency - without changing how your kitchen works. ,
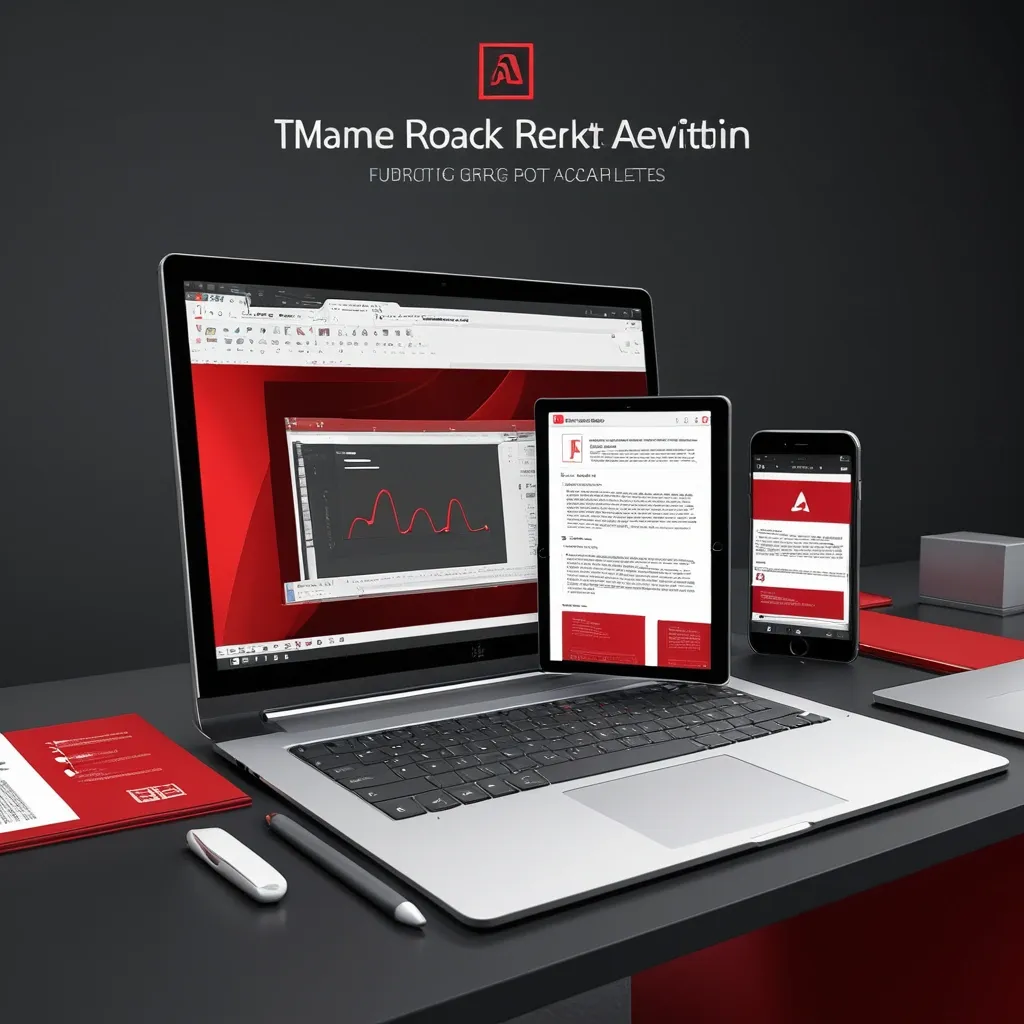
Create a high-quality Facebook marketing image for Adobe Acrobat Studio featuring a modern professional workspace with a sleek laptop and tablet displaying vibrant PDF documents , AI assistant visuals , and creative design elements , highlighting advanced PDF tools such as PDF editing , OCR , e-signature , file conversion , and document security , alongside AI-powered features like smart Summarization , insights , and automation , and incorporating Adobe Express creative tools elements like templates , graphics , and visual assets , all presented in a clean , premium , and futuristic style with a color palette of deep Adobe red , crisp white , dark gray , and black , set against a minimal background with sharp focus , realistic lighting , and a professional corporate tech look that exudes power , intelligence , and productivity , perfect for a Facebook post advertisement with ultra-high resolution and crisp details. ,
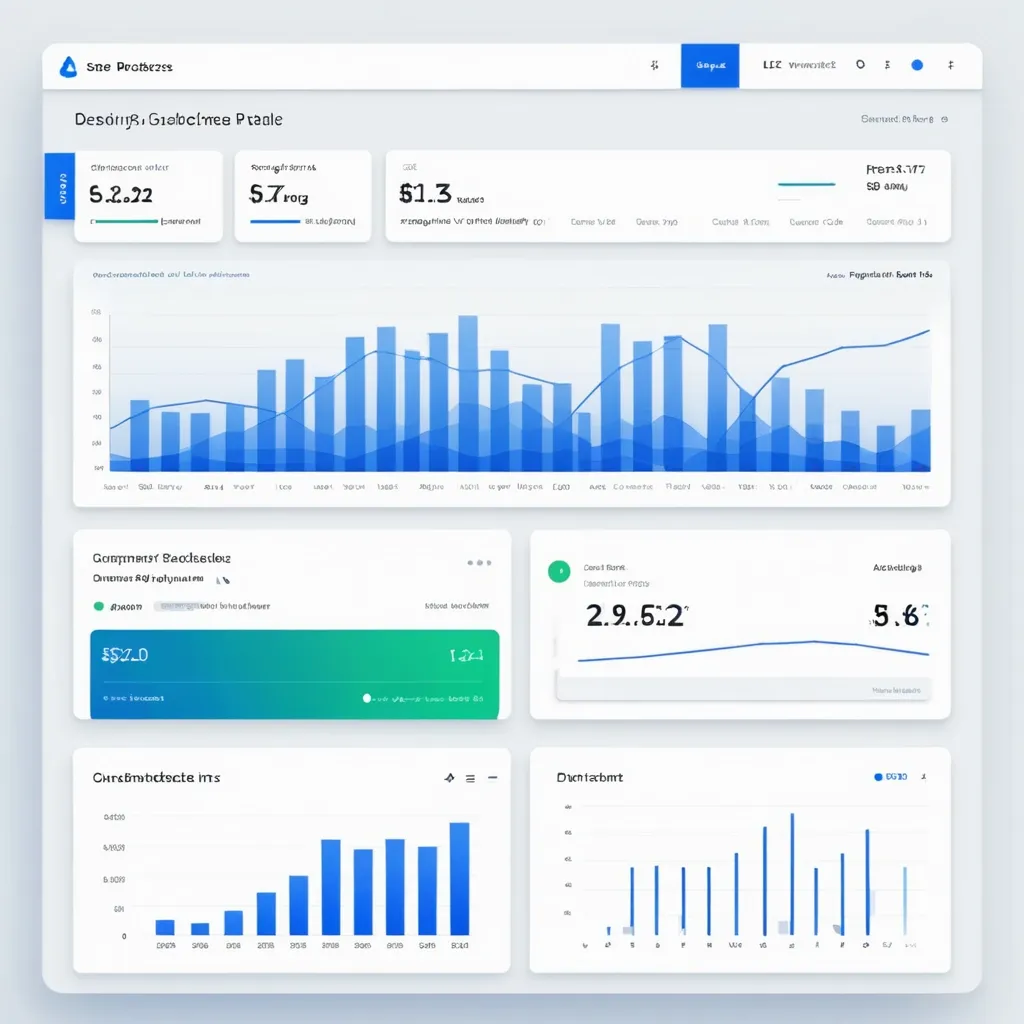
Design a clean , professional Analytics Page for the SynCloud Customer Portal. The page should focus on usage insights and billing alerts. Include the following features: Overview Cards (Top Section) Total API Requests (count) Total Compute Tokens used Current Billing Cycle Usage (percentage of quota consumed) Last Request Timestamp Budget Threshold Alerts Show colored alert bars at 50% , 80% , and 100% usage. Example: Green (50%) , Orange (80%) , Red (100%). Notifications panel showing recent alerts. Charts & Graphs Line chart: Daily API requests (last 7 days). Bar chart: Token consumption per week. Pie chart: Requests by service type (Playground , API , Agent). Detailed Usage History (Table) Columns: Date , Time , Request Type , Tokens Used , Status (Success/Failed). Search and filter by date range , request type. Option to export data as CSV/PDF. UX Considerations Sidebar navigation link highlighted: Analytics. Responsive layout (desktop + mobile). Minimal color palette with blue/white gradients and soft shadows. Tooltips on graphs for detailed insights. ,
Fairness means ensuring your analysis doesn't create or reinforce bias. This can be challenging , but if the analysis is not objective , the conclusions can be misleading and even harmful. In this reading , you’re going to explore some best practices you can use to guide your work toward a more fair analysis! Consider fairness Following are some strategies that support fair analysis: Best practice Explanation Example Consider all of the available data Part of your job as a data analyst is to determine what data is going to be useful for your analysis. Often there will be data that isn’t relevant to what you’re focusing on or doesn’t seem to align with your expectations. But you can’t just ignore it; it’s critical to consider all of the available data so that your analysis reflects the truth and not just your own expectations. A state’s Department of Transportation is interested in measuring traffic patterns on holidays. At first , they only include metrics related to traffic volumes and the fact that the days are holidays. But the data team realizes they failed to consider how weather on these holidays might also affect traffic volumes. Considering this additional data helps them gain more complete insights. Identify surrounding factors As you’ll learn throughout these courses , context is key for you and your stakeholders to understand the final conclusions of any analysis. Similar to considering all of the data , you also must understand surrounding factors that could influence the insights you’re gaining. A human resources department wants to better plan for employee vacation time in order to anticipate staffing needs. HR uses a list of national bank holidays as a key part of the data-gathering process. But they fail to consider important holidays that aren’t on the bank calendar , which introduces bias against employees who celebrate them. It also gives HR less useful results because bank holidays may not necessarily apply to their actual employee population. Include self-reported data Self-reporting is a data collection technique where participants provide information about themselves. Self-reported data can be a great way to introduce fairness in your data collection process. People bring conscious and unconscious bias to their observations about the world , including about other people. Using self-reporting methods to collect data can help avoid these observer biases. Additionally , separating self-reported data from other data you collect provides important context to your conclusions! A data analyst is working on a project for a brick-and-mortar retailer. Their goal is to learn more about their customer base. This data analyst knows they need to consider fairness when they collect data; they decide to create a survey so that customers can self-report information about themselves. By doing that , they avoid bias that might be introduced with other demographic data collection methods. For example , if they had sales associates report their observations about customers , they might introduce any unconscious bias the employees had to the data. Use oversampling effectively When collecting data about a population , it’s important to be aware of the actual makeup of that population. Sometimes , oversampling can help you represent groups in that population that otherwise wouldn’t be represented fairly. Oversampling is the process of increasing the sample size of nondominant groups in a population. This can help you better represent them and address imbalanced datasets. A fitness company is releasing new digital content for users of their equipment. They are interested in designing content that appeals to different users , knowing that different people may interact with their equipment in different ways. For example , part of their user-base is age 70 or older. In order to represent these users , they oversample them in their data. That way , decisions they make about their fitness content will be more inclusive. Think about fairness from beginning to end To ensure that your analysis and final conclusions are fair , be sure to consider fairness from the earliest stages of a project to when you act on the data insights. This means that data collection , cleaning , processing , and analysis are all performed with fairness in mind. A data team kicks off a project by including fairness measures in their data-collection process. These measures include oversampling their population and using self-reported data. However , they fail to inform stakeholders about these measures during the presentation. As a result , stakeholders leave with skewed understandings of the data. Learning from this experience , they add key information about fairness considerations to future stakeholder presentations. ,

"Within the avatar's frame , a white knight emerges , their armor a harmonious blend of medieval and futuristic elements. The centerpiece is the helmet , a stunning masterpiece that demands attention. The front of the helmet is pristine white , gleaming with a polished finish that reflects the light. As the eye traces towards the back , it transitions seamlessly to a deep black , adding an air of mystery. The helmet boasts a unique V-shaped design that encompasses both the front and back sections. The front , reminiscent of a knight's visor , has a sleek and angular shape that evokes modern sophistication. Enhanced with a heads-up display , the visor provides crucial information and tactical insights to the knight. As the helmet extends towards the back , it transforms into a sweeping curve of obsidian black. The black surface features subtle engravings that pay homage to medieval craftsmanship. The contrasting colors and shapes symbolize the knight's ability to bridge the past and the future. Set against a backdrop of vibrant red and white , this avatar captivates with its futuristic yet medieval aesthetic. The combination of the white front and black V-shaped back of the helmet , along with the harmonious color palette , conveys a sense of strength , elegance , and enigmatic allure." ,

Create an image depicting the chess' king as the visionary leader of the data-driven kingdom , a symbol of authority and wisdom in the realm of business strategy. The king is portrayed as a distinguished and confident figure , radiating a sense of power and control. The image should showcase the king seated on a throne , adorned with symbols of data and technology , emphasizing his central role in guiding the organization's data-driven initiatives. Surrounding the king , incorporate elements that represent the interconnectedness of data and business , such as network patterns or data visualizations , symbolizing the king's ability to make informed decisions based on valuable insights. The image should evoke a sense of respect and admiration for the king's strategic prowess and his ability to lead the organization towards success through data-driven approaches. ,

"Within the avatar's frame , a white knight emerges , their armor a harmonious blend of medieval and futuristic elements. The centerpiece is the helmet , a stunning masterpiece that demands attention. The front of the helmet is pristine white , gleaming with a polished finish that reflects the light. As the eye traces towards the back , it transitions seamlessly to a deep black , adding an air of mystery. The helmet boasts a unique V-shaped design that encompasses both the front and back sections. The front , reminiscent of a knight's visor , has a sleek and angular shape that evokes modern sophistication. Enhanced with a heads-up display , the visor provides crucial information and tactical insights to the knight. As the helmet extends towards the back , it transforms into a sweeping curve of obsidian black. The black surface features subtle engravings that pay homage to medieval craftsmanship. The contrasting colors and shapes symbolize the knight's ability to bridge the past and the future. Set against a backdrop of vibrant red and white , this avatar captivates with its futuristic yet medieval aesthetic. The combination of the white front and black V-shaped back of the helmet , along with the harmonious color palette , conveys a sense of strength , elegance , and enigmatic allure." ,

Develop an artificial intelligence model capable of analyzing images of children fishing in lakes within parks , identifying the presence of trees , the type of fish caught , and the quality of the natural environment. The goal is to create a tool that can provide detailed insights into the fishing experience , contributing to environmental preservation and promoting outdoor recreational activitie ,

Create an image depicting the chess' king as the visionary leader of the data-driven kingdom , a symbol of authority and wisdom in the realm of business strategy. The king is portrayed as a distinguished and confident figure , radiating a sense of power and control. The image should showcase the king seated on a throne , adorned with symbols of data and technology , emphasizing his central role in guiding the organization's data-driven initiatives. Surrounding the king , incorporate elements that represent the interconnectedness of data and business , such as network patterns or data visualizations , symbolizing the king's ability to make informed decisions based on valuable insights. The image should evoke a sense of respect and admiration for the king's strategic prowess and his ability to lead the organization towards success through data-driven approaches. ,
Create an eye-catching image that showcases the power of Samay , our all-in-one business companion. Visualize a vibrant , bustling small store where Samay is seamlessly managing inventory , tracking sales and purchases , streamlining accounting tasks , and providing real-time sales predictions. Highlight the ease of use , efficiency , and data-driven insights that Samay brings to small businesses. Let the image convey the message that with Samay , business owners have everything they need at their fingertips to succeed. Use bright colors and a modern , clean design to captivate our audience and make them eager to discover how Samay can transform their businesses. ,
Create an image depicting the chess' king as the visionary leader of the data-driven kingdom , a symbol of authority and wisdom in the realm of business strategy. The king is portrayed as a distinguished and confident figure , radiating a sense of power and control. The image should showcase the king seated on a throne , adorned with symbols of data and technology , emphasizing his central role in guiding the organization's data-driven initiatives. Surrounding the king , incorporate elements that represent the interconnectedness of data and business , such as network patterns or data visualizations , symbolizing the king's ability to make informed decisions based on valuable insights. The image should evoke a sense of respect and admiration for the king's strategic prowess and his ability to lead the organization towards success through data-driven approaches. ,


Design a logo that embodies the spirit of a workshop aimed at assisting parents in effectively supporting their children with ADHD. Create an emblem that reflects a sense of unity and cooperation among parents coming together to exchange insights and experiences. Incorporate elements that symbolize practical strategies and evidence-based approaches for comprehending and managing ADHD in children. The logo should communicate feelings of empowerment , empathy , and togetherness while addressing this significant subject ,
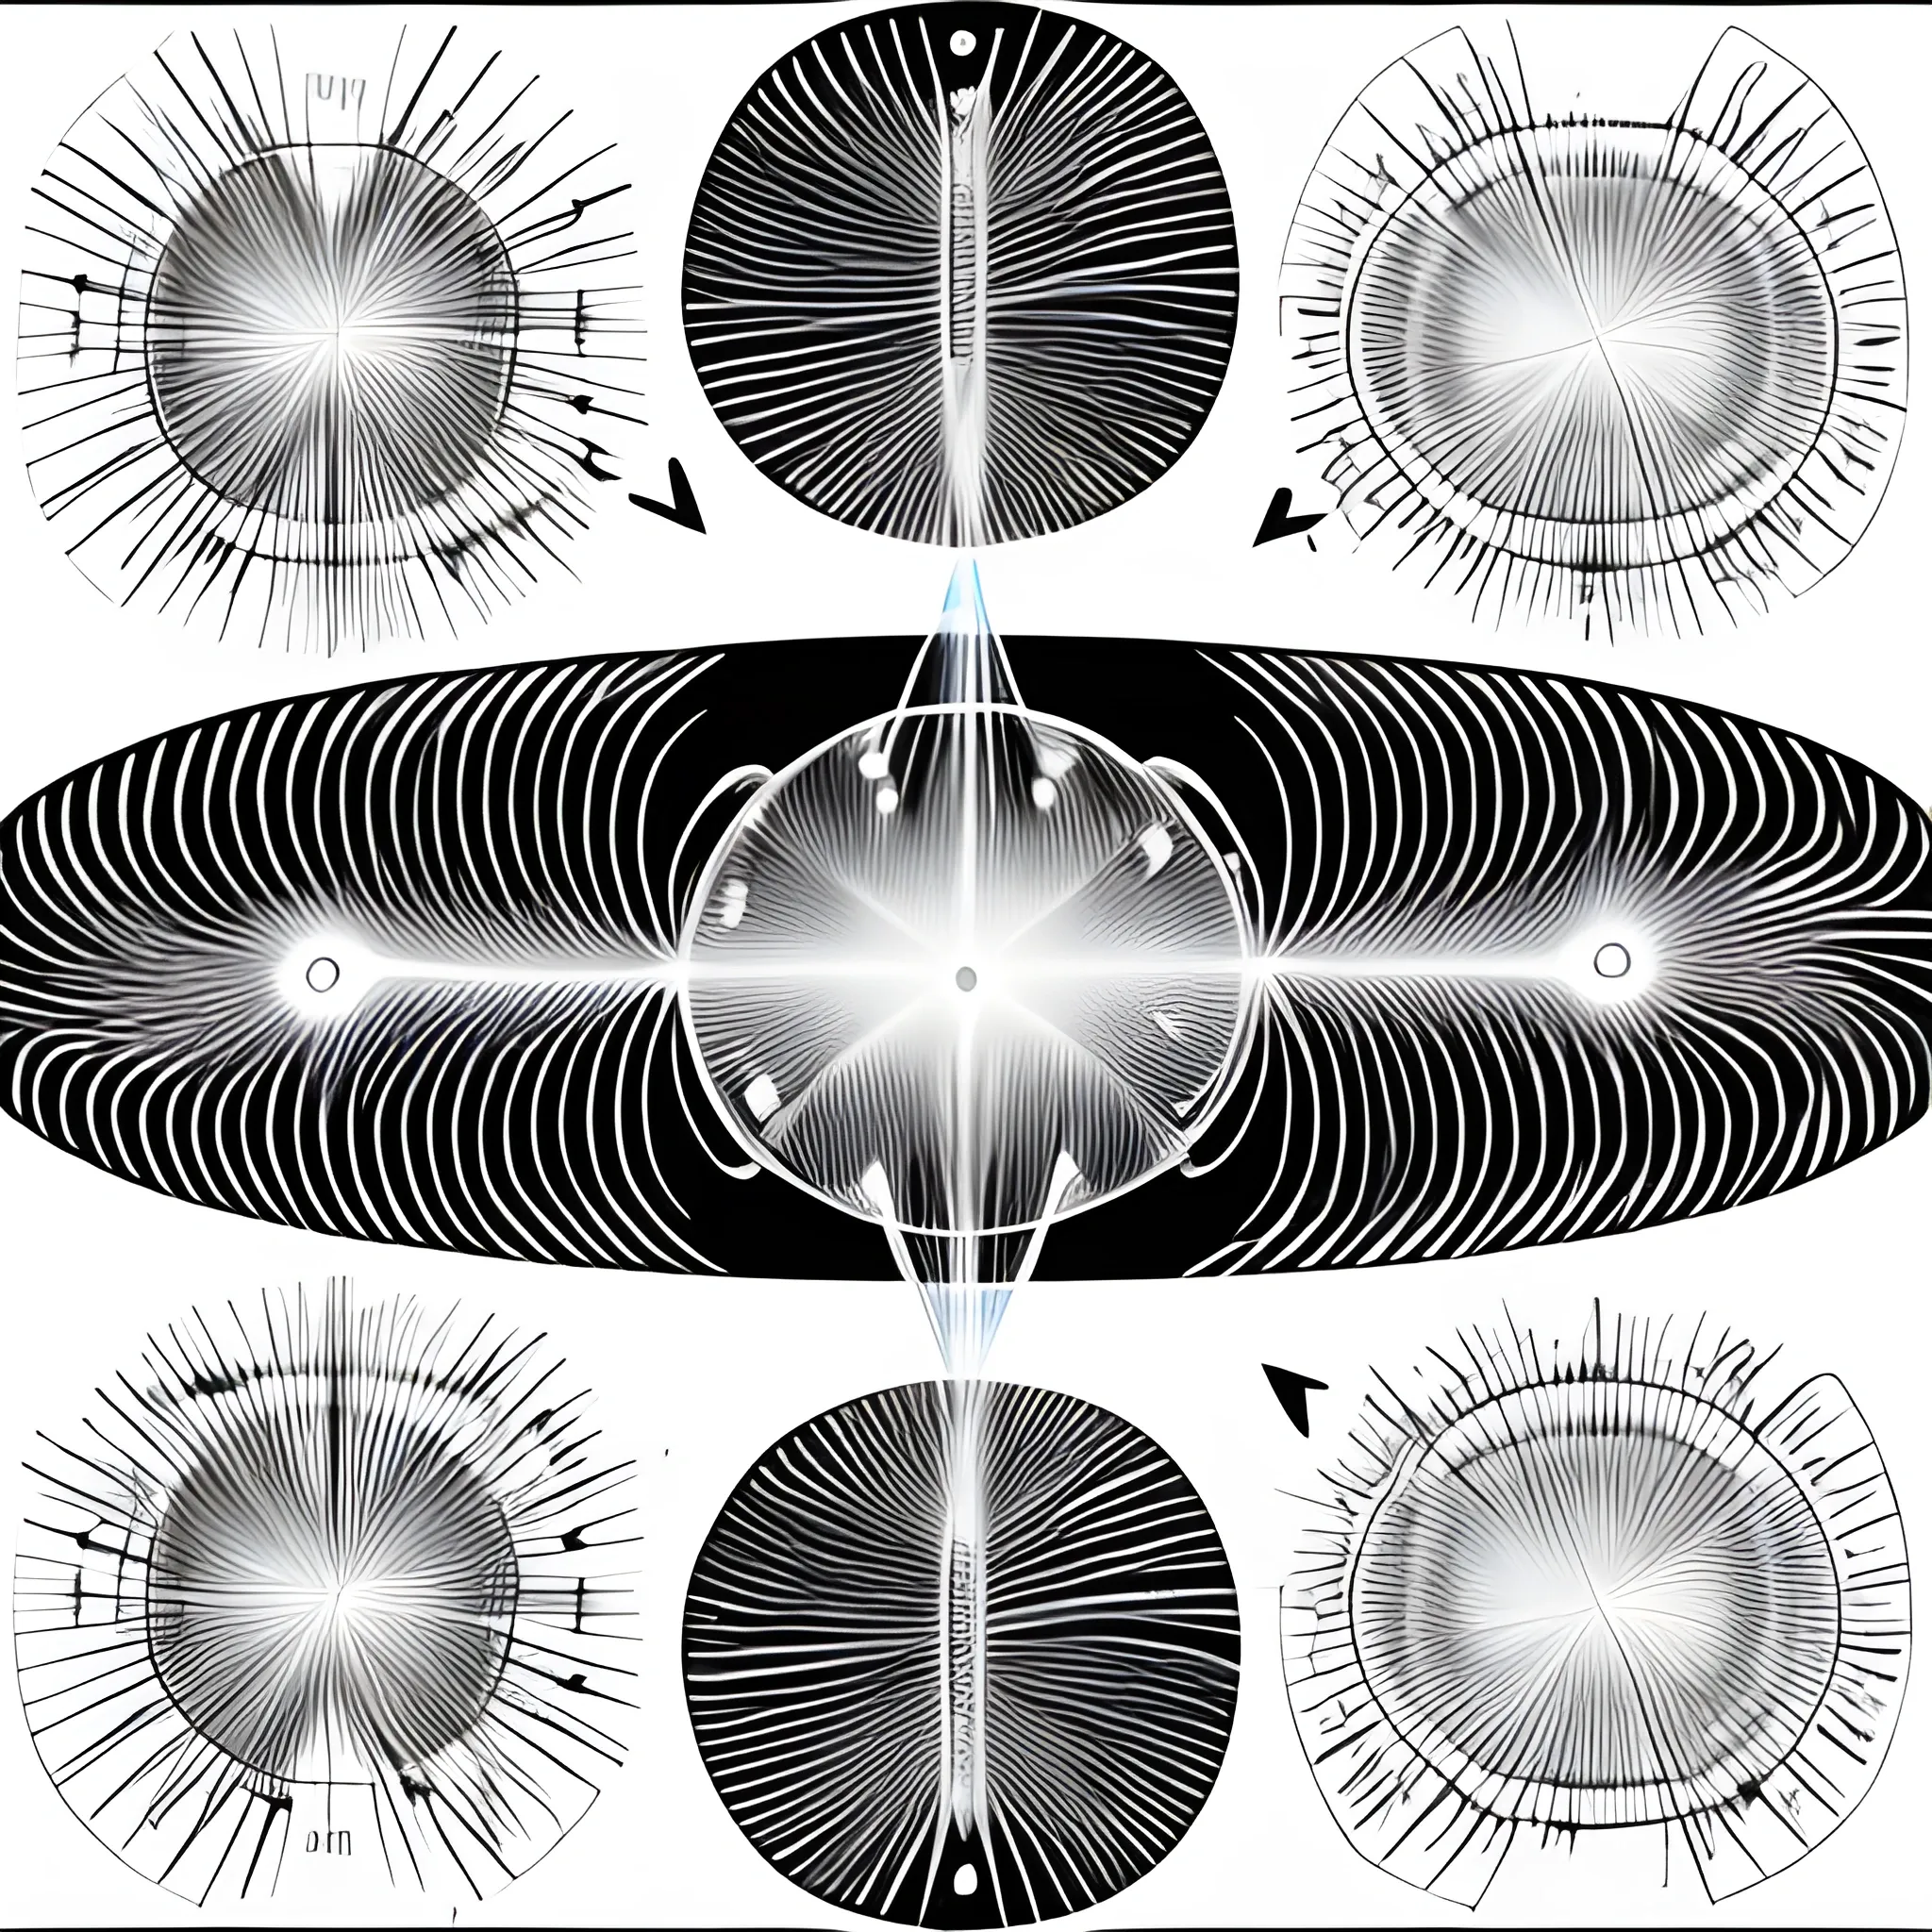
Generate images illustrating the electric field lines between two positively charged particles and one negatively charged particle. Visualize the distribution of the electric field around the charges , considering the magnitudes and signs of the charges. Highlight the interactions and patterns of the electric field lines in a clear and informative manner. Feel free to represent the charges as point sources or use any appropriate visualization technique to convey the electric field configuration. Provide insights into how the electric field behaves in the presence of these charges ,

Design a logo that embodies the spirit of a workshop aimed at assisting parents in effectively supporting their children with ADHD. Create an emblem that reflects a sense of unity and cooperation among parents coming together to exchange insights and experiences. Incorporate elements that symbolize practical strategies and evidence-based approaches for comprehending and managing ADHD in children. The logo should communicate feelings of empowerment , empathy , and togetherness while addressing this significant subject ,