Search Results for Analytics
Explore AI generated designs, images, art and prompts by top community artists and designers.
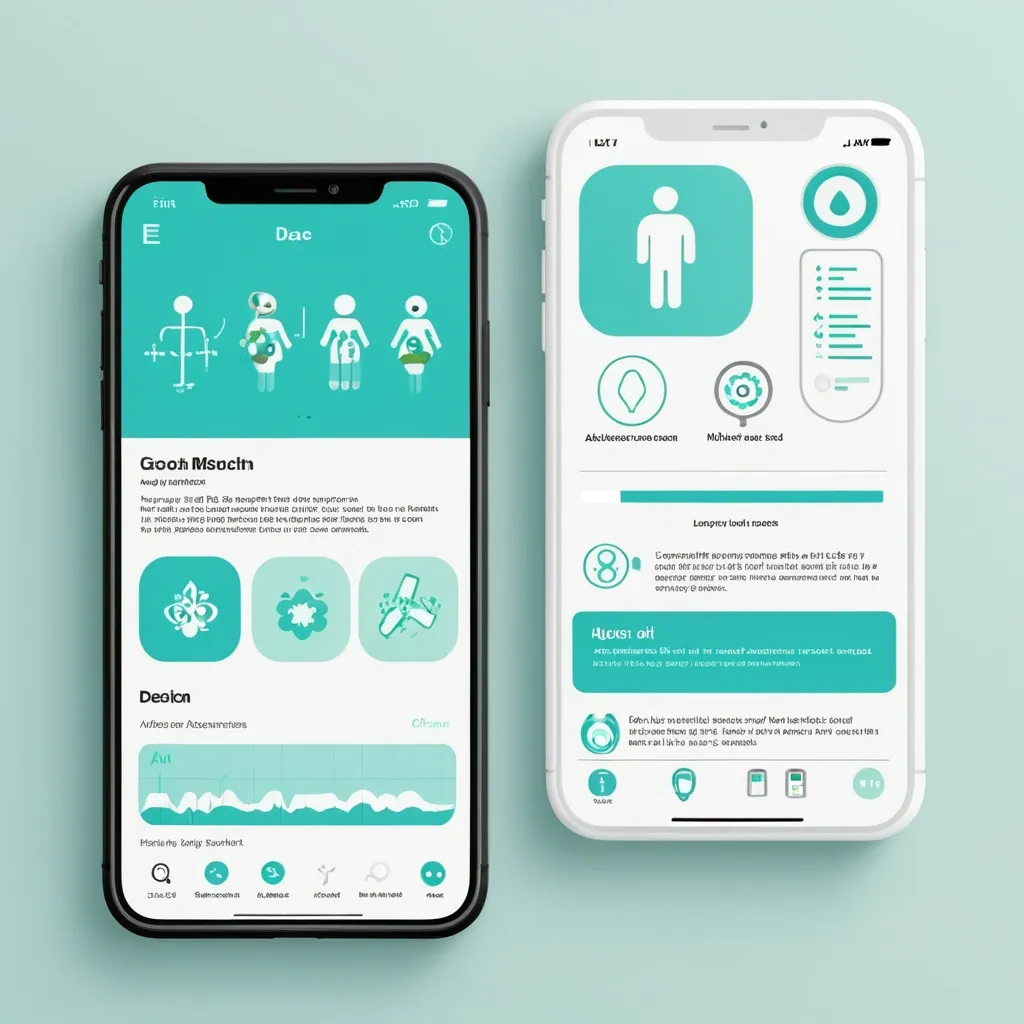

Разработай макет приложения для здоровья. Краткое описание идеи Приложение , которое: Распознает медицинские анализы по фото (ОАК , биохимия , гормоны и др.) Строит динамические графики показателей во времени Хранит заключения специалистов с возможностью поиска и структурирования Собирает профиль пользователя (пол , возраст , вес , хронические заболевания) Предоставляет AI-рекомендации по питанию , физической активности , ментальному здоровью. Философия дизайна «Забота и ясность» — дизайн должен создавать ощущение: ✅ Безопасности — пользователь доверяет приложению свои медицинские данные ✅ Профессионализма — научный подход , точность , надежность ✅ Заботы — теплота , поддержка , мотивация к здоровью ✅ Ясности — простота восприятия сложной медицинской информации. Mobile app UI design , medical health tracker dashboard , clean minimal style , soft pastel colors: primary turquoise #5DBCD2 , lavender #9B9ED6 , white background #F8FAFC , dark gray text #2D3748. Layout: Top greeting "Добрый день , Анна!" with health score circular widget (85/100 , mint green progress ring). Below: 4 rounded square quick-action cards with soft icons (Documents , Charts , AI Assistant , Appointments). Section "Последние анализы": two white cards with rounded corners (20px) , subtle shadow , each showing test name (🩸 Общий анализ крови) , date , and status badge (✓ Норма in mint green , ⚠ Повыш. in coral). AI recommendation card at bottom: soft gradient background , robot icon , short text tip about hydration. Bottom navigation bar: 5 icons (Home , Analytics , Add , Chat , Profile) , active icon in turquoise , blurred white background. Style: Medical Minimalism 2.0 , glassmorphism elements , soft UI , organic rounded shapes , calm aesthetic , professional but friendly. High fidelity , Figma-style mockup , iOS design guidelines , 375x812px frame , light mode. --ar 9:19 --style raw ,
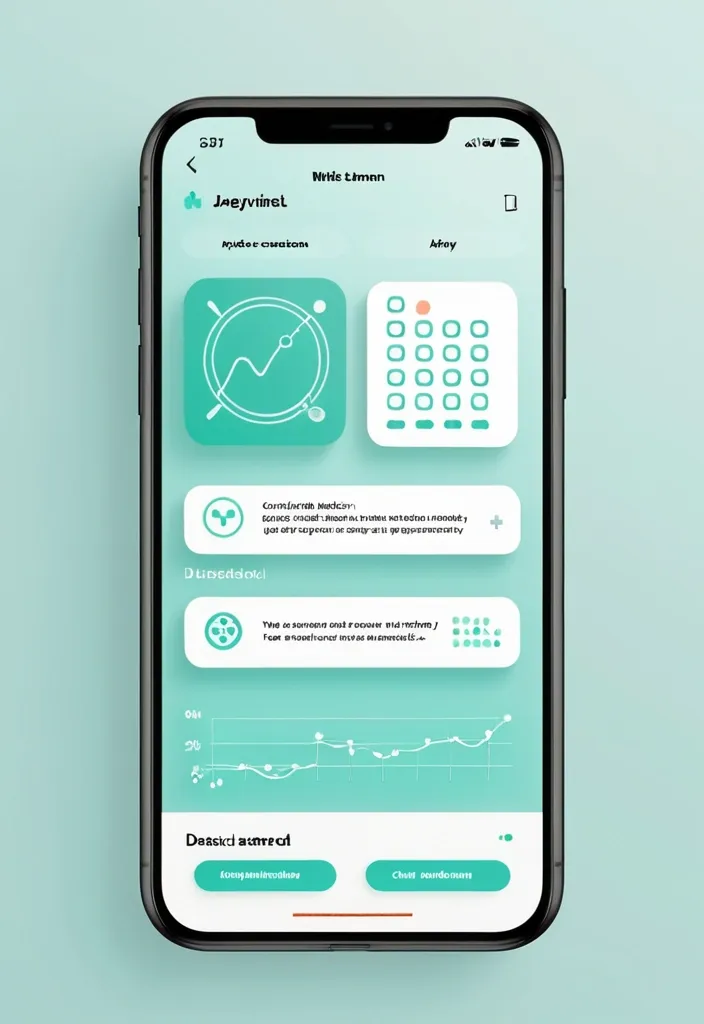
Разработай макет приложения для здоровья. Краткое описание идеи Приложение , которое: Распознает медицинские анализы по фото (ОАК , биохимия , гормоны и др.) Строит динамические графики показателей во времени Хранит заключения специалистов с возможностью поиска и структурирования Собирает профиль пользователя (пол , возраст , вес , хронические заболевания) Предоставляет AI-рекомендации по питанию , физической активности , ментальному здоровью. Философия дизайна «Забота и ясность» — дизайн должен создавать ощущение: ✅ Безопасности — пользователь доверяет приложению свои медицинские данные ✅ Профессионализма — научный подход , точность , надежность ✅ Заботы — теплота , поддержка , мотивация к здоровью ✅ Ясности — простота восприятия сложной медицинской информации. Mobile app UI design , medical health tracker dashboard , clean minimal style , soft pastel colors: primary turquoise #5DBCD2 , lavender #9B9ED6 , white background #F8FAFC , dark gray text #2D3748. Layout: Top greeting "Добрый день , Анна!" with health score circular widget (85/100 , mint green progress ring). Below: 4 rounded square quick-action cards with soft icons (Documents , Charts , AI Assistant , Appointments). Section "Последние анализы": two white cards with rounded corners (20px) , subtle shadow , each showing test name (🩸 Общий анализ крови) , date , and status badge (✓ Норма in mint green , ⚠ Повыш. in coral). AI recommendation card at bottom: soft gradient background , robot icon , short text tip about hydration. Bottom navigation bar: 5 icons (Home , Analytics , Add , Chat , Profile) , active icon in turquoise , blurred white background. Style: Medical Minimalism 2.0 , glassmorphism elements , soft UI , organic rounded shapes , calm aesthetic , professional but friendly. High fidelity , Figma-style mockup , iOS design guidelines , 375x812px frame , light mode. --ar 9:19 --style raw ,
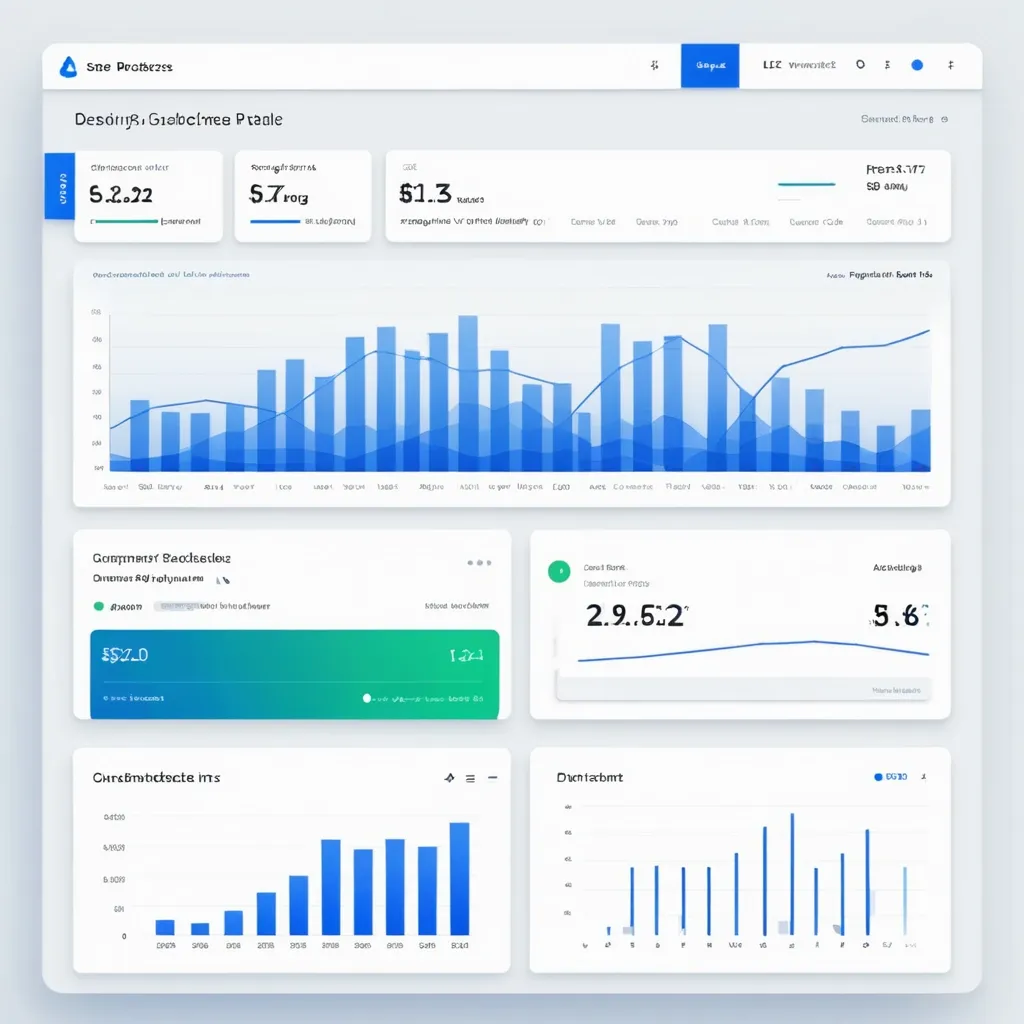
Design a clean , professional Analytics Page for the SynCloud Customer Portal. The page should focus on usage insights and billing alerts. Include the following features: Overview Cards (Top Section) Total API Requests (count) Total Compute Tokens used Current Billing Cycle Usage (percentage of quota consumed) Last Request Timestamp Budget Threshold Alerts Show colored alert bars at 50% , 80% , and 100% usage. Example: Green (50%) , Orange (80%) , Red (100%). Notifications panel showing recent alerts. Charts & Graphs Line chart: Daily API requests (last 7 days). Bar chart: Token consumption per week. Pie chart: Requests by service type (Playground , API , Agent). Detailed Usage History (Table) Columns: Date , Time , Request Type , Tokens Used , Status (Success/Failed). Search and filter by date range , request type. Option to export data as CSV/PDF. UX Considerations Sidebar navigation link highlighted: Analytics. Responsive layout (desktop + mobile). Minimal color palette with blue/white gradients and soft shadows. Tooltips on graphs for detailed insights. ,
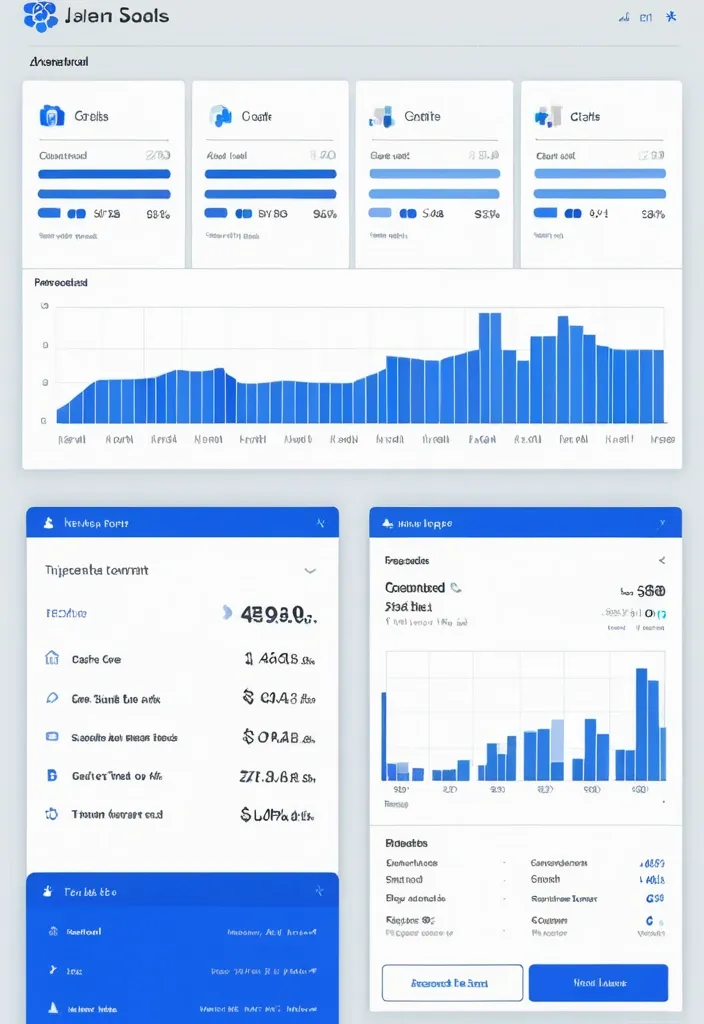
"Design a modern analytics dashboard for SynCloud Customer Portal. Show top stat cards: Total API Requests , Compute Tokens Used , Billing Cycle % with 50/80/100% alerts , and Last Request. Add visual charts: line chart for daily requests , bar chart for weekly token usage , pie chart for requests by service type. Include a usage history table with Date , Request Type , Tokens Used , Status , plus filters and export option. Clean SaaS style , sidebar navigation with Analytics highlighted , responsive design , blue/white theme , minimal and professional." ,
Generate an image of a sleek and modern logo featuring the letters 'BTN' in a creative and prominent manner. Utilize a minimalistic design , with bold lines and sharp edges , to convey sophistication and clarity. Implement a futuristic color palette , incorporating hues such as electric blue , neon green , and metallic silver , to signify innovation and technology. Consider adding subtle elements that represent data analytics , machine learning , or artificial intelligence , such as a stylized circuit pattern or a simple graph. Ensure the final output is a high-resolution image , optimized for various applications including print , web , mobile , and social media platforms. ,